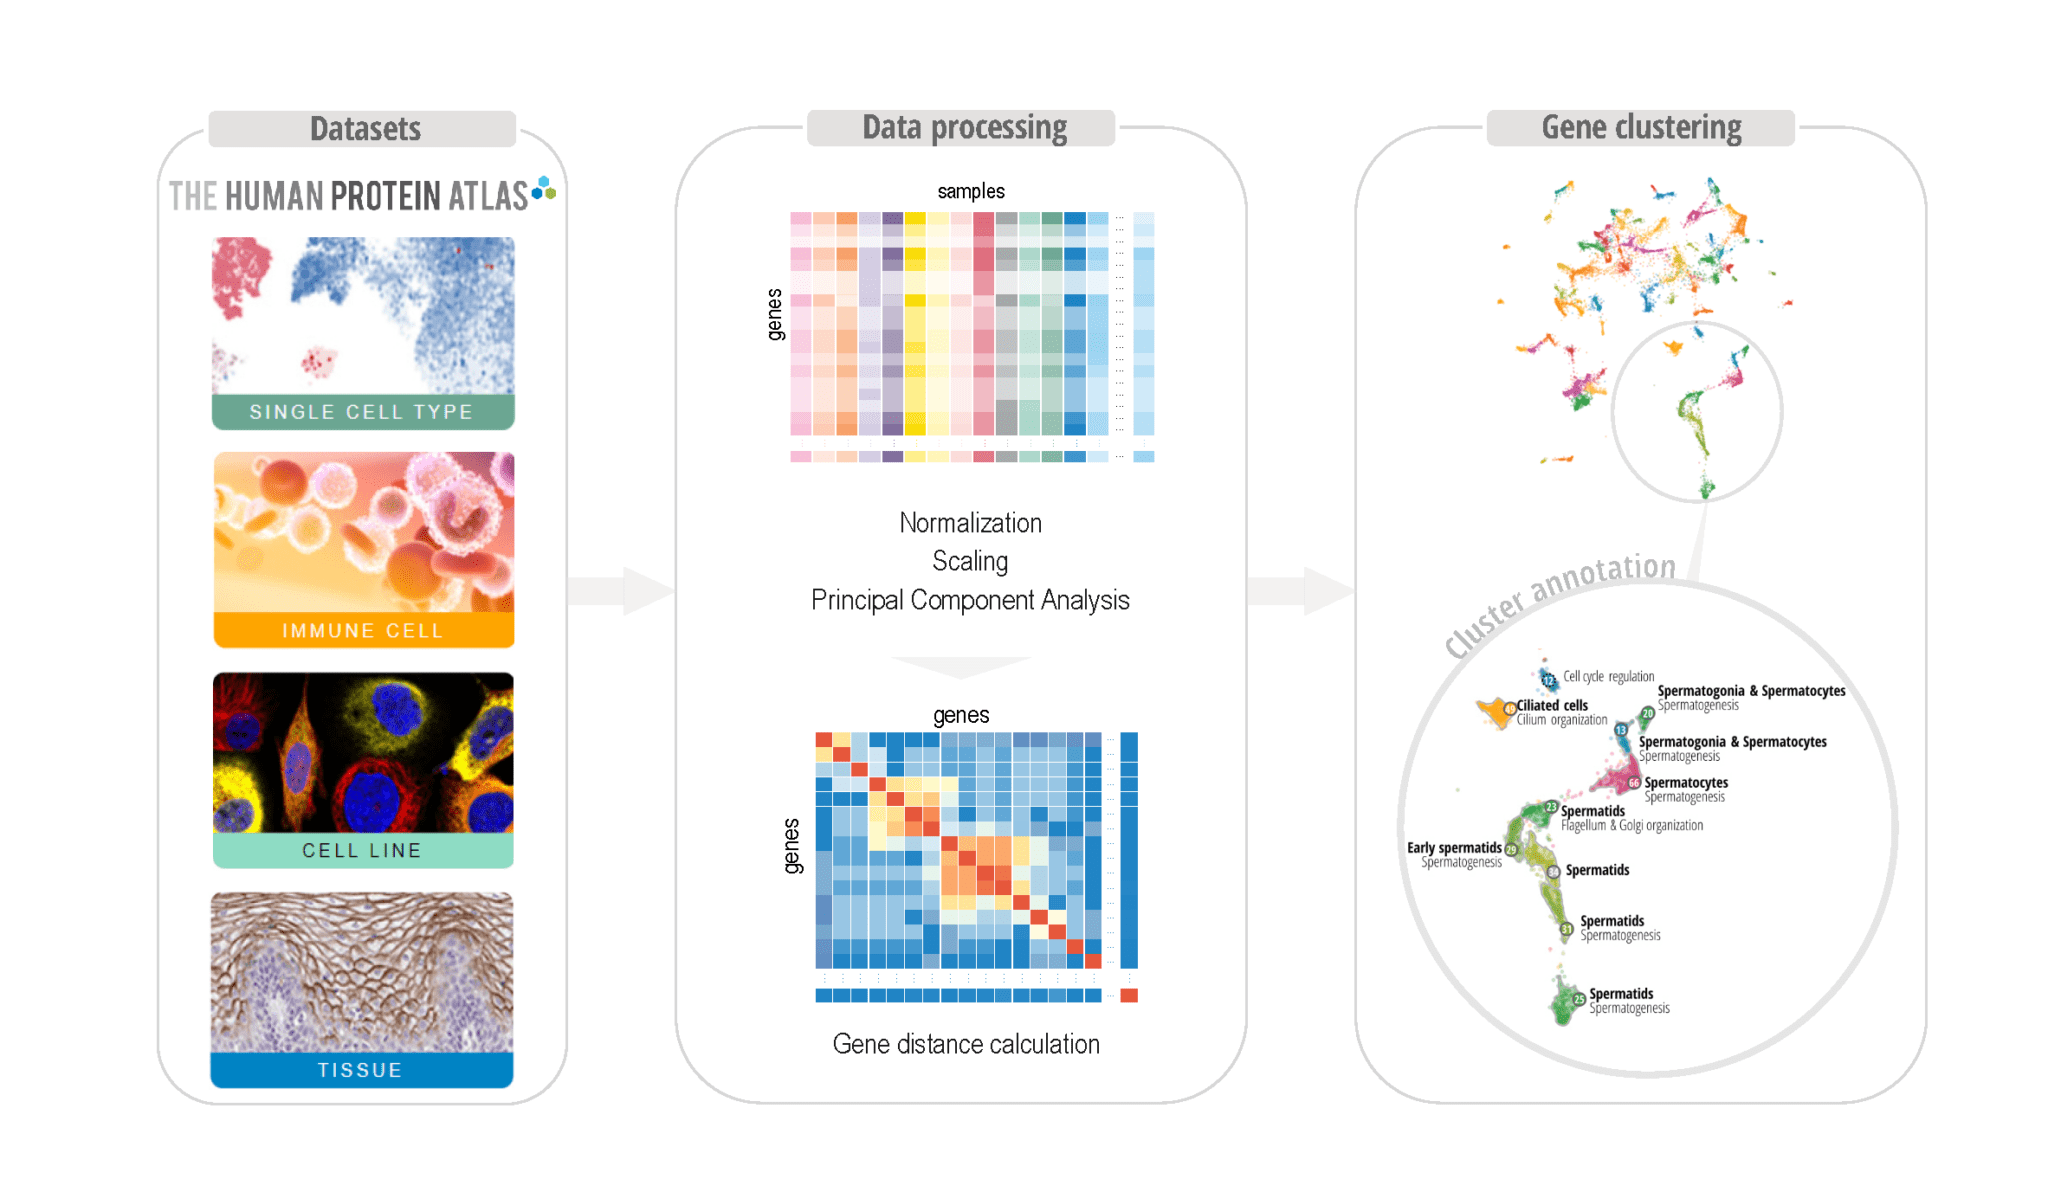
Clustering pipeline used to develop an unsupervised gene clustering framework supported by visual analytics. The data will be publicly made available and visualized in the [Human Protein Atlas].


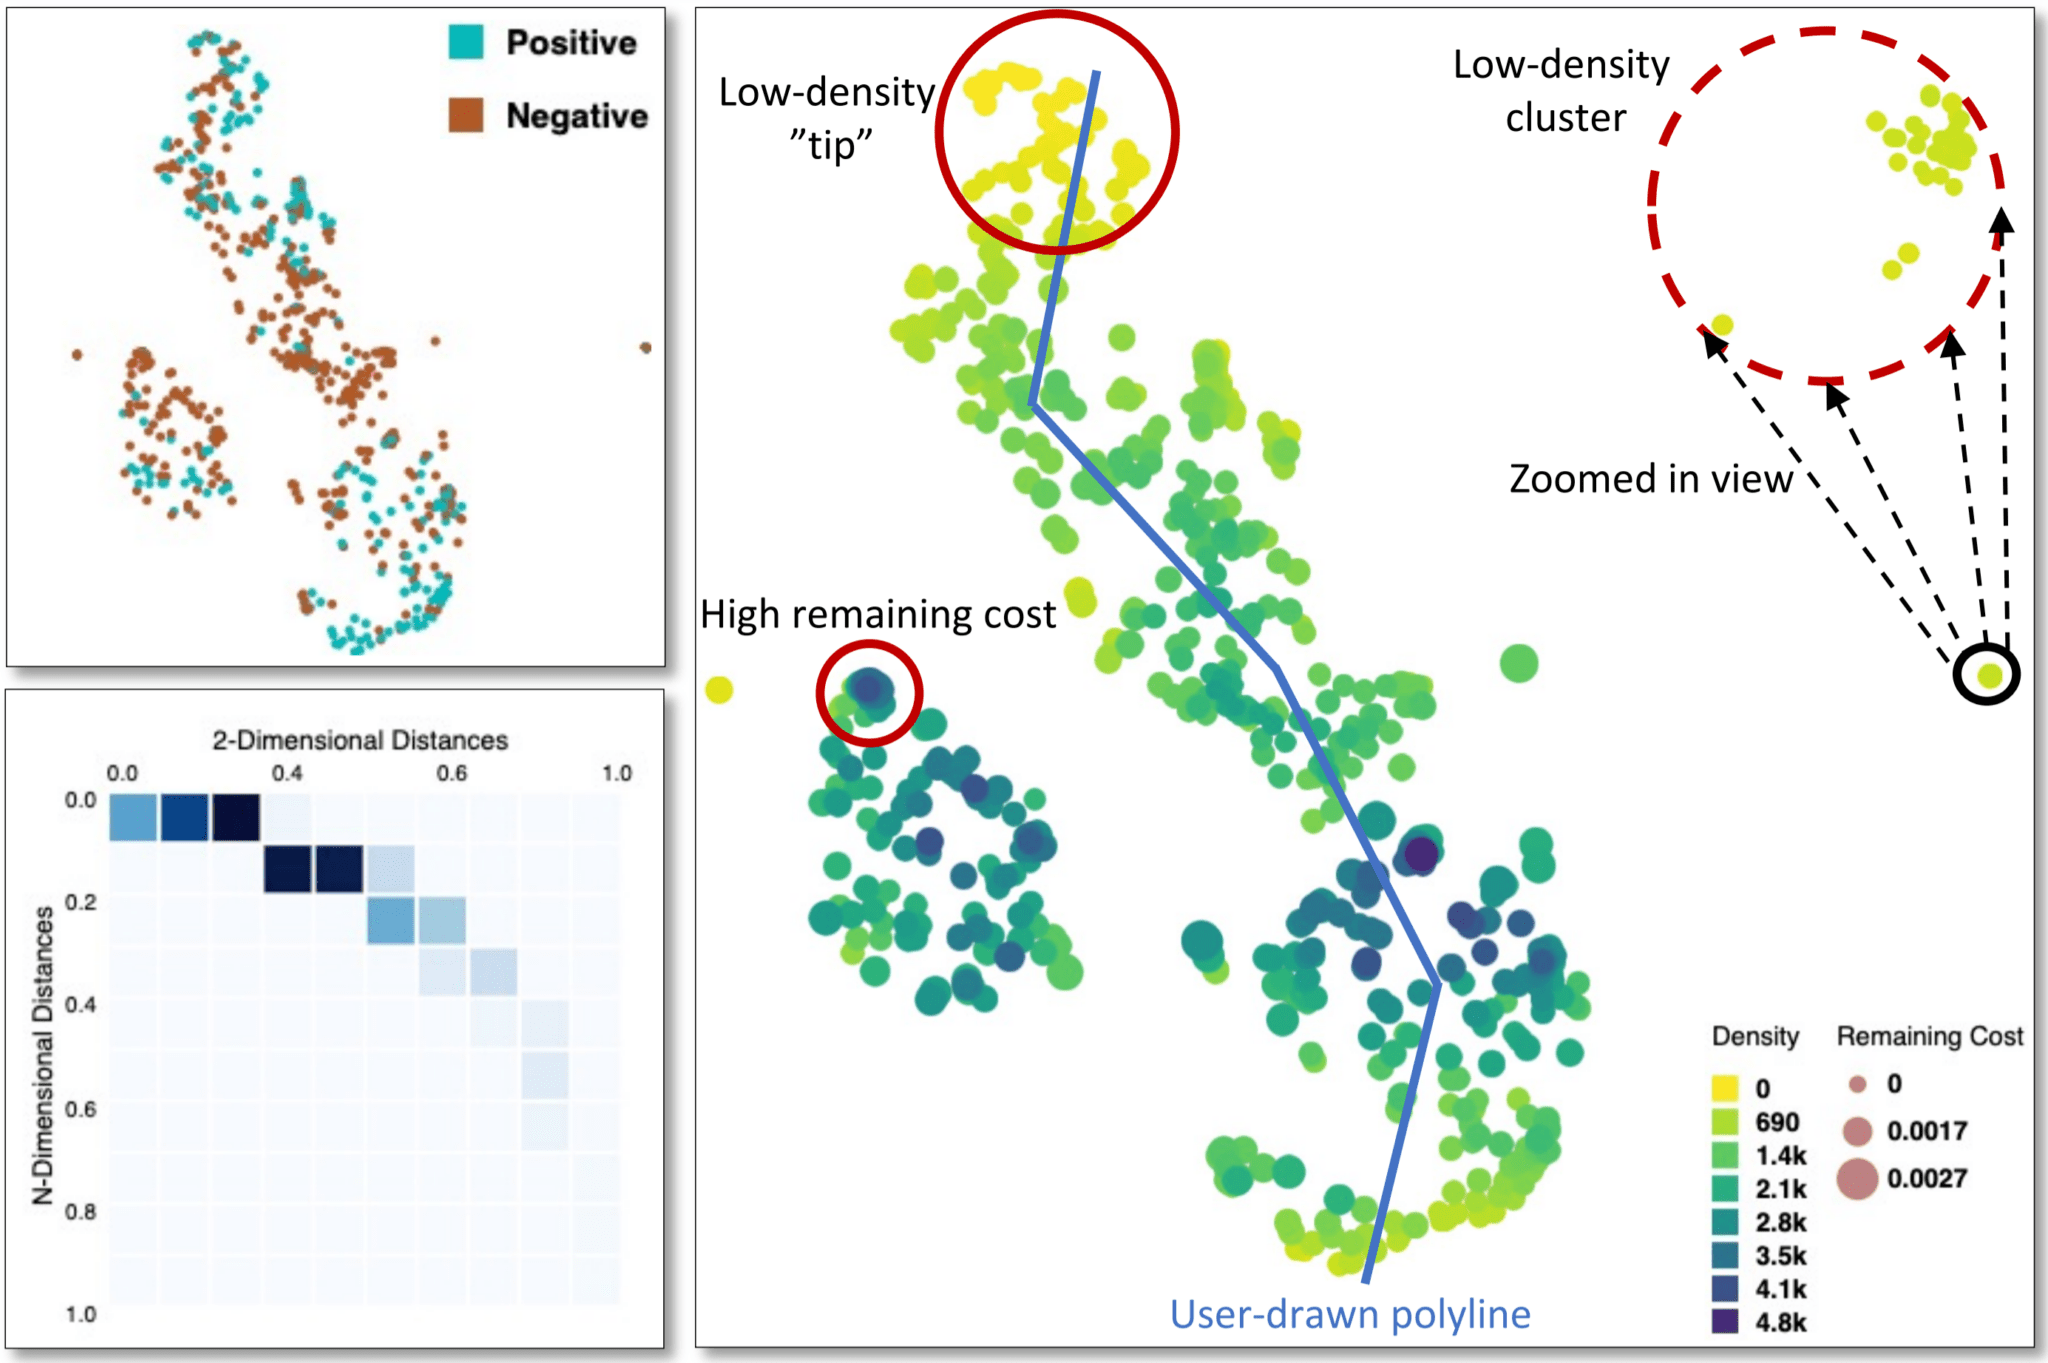
Example of a visual analytics tool, called [t-viSNE], for the visual exploration of t-SNE projections that enables analysts to inspect different aspects of their accuracy and meaning. Similar approaches will be developed in the project to provide interpretable and interactive clustering, fine-grained quality analysis of the clustering, as well as better cluster annotation by using visual analytics.


Last updated: 2022-03-01

Content Responsible: Johan Inganni(johan.inganni@scilifelab.se)

Help Us Improve!
We want to better match our services with your needs—take our short survey and help shape SciLifeLab’s digital future. You can also join our user panel for occasional feedback opportunities and early access to new tools.
Help Us Improve!
We want to better match our services with your needs—take our short survey and help shape SciLifeLab’s digital future. You can also join our user panel for occasional feedback opportunities and early access to new tools.